-
HAPPY DALE ONLINE SANITARIUM
-
The place where you are never more than a few clicks away from normality

Follow us on
CHARTS
Organization, analysis, interpretation, and presentation of data needs to be compelling and even entertaining to be effective.
Charts help to hem in the insanity here at Happy Dale... Once inmates get used to daily routines, it is easy to classify their behavior and present it as data in the form of pie charts or triangular graphs .

Charts serve to enable better understanding
Our patients are not just figures, or lines on a graph, though, we do need to keep our organization running ship shape. Clothing and especially hats are used to categorize patients in a systematic fashion. Pie charts work well in the cafeteria. Also in the cafeteria we use different colored menus to distinguish patient groups.
Charts serve to reduce random conclusions
Without the use of statistical consultants, we remain available to provide help for ours and even other organizations and companies without direct access to the expertise relevant to their particular problems.
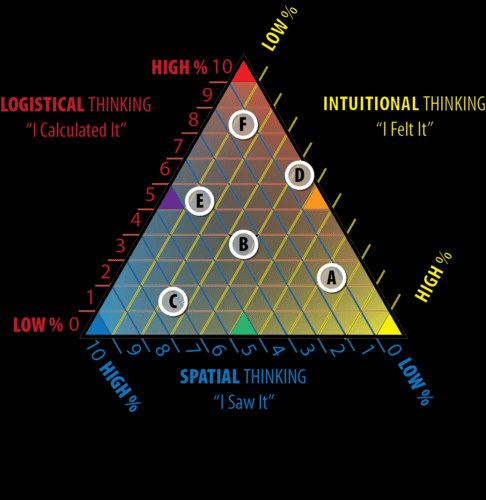
Our Triangular chart methods are used for summarizing and describing a collection of obtuse data; involving descriptive statistics. This is quite useful in our research, when communicating the results of our experiments. In addition, patterns in the data may be modeled in a way that accommodates our Holistic trilateral approach to mental health, (body, soul, mind), allowing you to achieve maximum benefits with minimum effort!

Charts can help to quantify unquantifiable data
Of all our research tools, statistics are the most versatile.
We can present data any way we choose. Politicians do not have a monopoply on their use. Once we get going, some of our meetings are simply inundated with graphs, pie charts and flow charts. Does it ever bother you when someone says "45% of the people bla bla bla" and they don't qualify by telling you "of Americnas", "young people", "immigrants" , "Canadians", "patients", "women or men" etc. so by the time you finish hearing the data they present, it has no valid use without the ability of comparison or contrast with other groups?